Visualization with Pokemon
Learn how to create a plot using ggplot2 package
 Image credit: Kamil S
Load Library
library(tidyverse)## ── Attaching packages ────────────────────────────────────────────────────────────────────────────────────────────── tidyverse 1.2.1 ──## ✔ ggplot2 3.2.1 ✔ purrr 0.3.3
## ✔ tibble 2.1.3 ✔ dplyr 0.8.3
## ✔ tidyr 1.0.0 ✔ stringr 1.4.0
## ✔ readr 1.3.1 ✔ forcats 0.4.0## ── Conflicts ───────────────────────────────────────────────────────────────────────────────────────────────── tidyverse_conflicts() ──
## ✖ dplyr::filter() masks stats::filter()
## ✖ dplyr::lag() masks stats::lag()library(gridExtra)##
## Attaching package: 'gridExtra'## The following object is masked from 'package:dplyr':
##
## combinelibrary(ggrepel)Data
Data was obtained and accessed via Kaggle.
According to the source, the data was collected from 3 different sites:
About
This data set includes 721 Pokemon, including their ID number, name, first and second type, and basic stats: HP, Attack, Defense, Special Attack, Special Defense, and Speed.
Imporatnt note: There are Pokemons that share the same ID number with a different evolution (mega evolution or alternative evolution). Thus, there are 800 observations in this dataset while there are only 721 Pokemon.
This are the raw attributes that are used for calculating how much damage an attack will do in the games. This dataset is about the Pokemon games (NOT Pokemon cards or Pokemon Go).
Read Data
Pokemon = read_csv("data/Pokemon.csv")## Parsed with column specification:
## cols(
## `#` = col_double(),
## Name = col_character(),
## `Type 1` = col_character(),
## `Type 2` = col_character(),
## Total = col_double(),
## HP = col_double(),
## Attack = col_double(),
## Defense = col_double(),
## `Sp. Atk` = col_double(),
## `Sp. Def` = col_double(),
## Speed = col_double(),
## Generation = col_double(),
## Legendary = col_logical()
## )Skim Data
Check for missing data and the distributions of each numeric variable.
skimr::skim(Pokemon)| Name | Pokemon |
| Number of rows | 800 |
| Number of columns | 13 |
| _______________________ | |
| Column type frequency: | |
| character | 3 |
| logical | 1 |
| numeric | 9 |
| ________________________ | |
| Group variables | None |
Variable type: character
| skim_variable | n_missing | complete_rate | min | max | empty | n_unique | whitespace |
|---|---|---|---|---|---|---|---|
| Name | 0 | 1.00 | 3 | 25 | 0 | 800 | 0 |
| Type 1 | 0 | 1.00 | 3 | 8 | 0 | 18 | 0 |
| Type 2 | 386 | 0.52 | 3 | 8 | 0 | 18 | 0 |
Variable type: logical
| skim_variable | n_missing | complete_rate | mean | count |
|---|---|---|---|---|
| Legendary | 0 | 1 | 0.08 | FAL: 735, TRU: 65 |
Variable type: numeric
| skim_variable | n_missing | complete_rate | mean | sd | p0 | p25 | p50 | p75 | p100 | hist |
|---|---|---|---|---|---|---|---|---|---|---|
| # | 0 | 1 | 362.81 | 208.34 | 1 | 184.75 | 364.5 | 539.25 | 721 | ▇▇▇▇▇ |
| Total | 0 | 1 | 435.10 | 119.96 | 180 | 330.00 | 450.0 | 515.00 | 780 | ▃▆▇▂▁ |
| HP | 0 | 1 | 69.26 | 25.53 | 1 | 50.00 | 65.0 | 80.00 | 255 | ▃▇▁▁▁ |
| Attack | 0 | 1 | 79.00 | 32.46 | 5 | 55.00 | 75.0 | 100.00 | 190 | ▂▇▆▂▁ |
| Defense | 0 | 1 | 73.84 | 31.18 | 5 | 50.00 | 70.0 | 90.00 | 230 | ▃▇▂▁▁ |
| Sp. Atk | 0 | 1 | 72.82 | 32.72 | 10 | 49.75 | 65.0 | 95.00 | 194 | ▅▇▅▂▁ |
| Sp. Def | 0 | 1 | 71.90 | 27.83 | 20 | 50.00 | 70.0 | 90.00 | 230 | ▇▇▂▁▁ |
| Speed | 0 | 1 | 68.28 | 29.06 | 5 | 45.00 | 65.0 | 90.00 | 180 | ▃▇▆▁▁ |
| Generation | 0 | 1 | 3.32 | 1.66 | 1 | 2.00 | 3.0 | 5.00 | 6 | ▇▅▃▅▂ |
Data Dictionary
#- ID for each PokemonName- Name of each PokemonType 1- Each Pokemon has a type, this determines weakness/resistance to attacks (Primary type)Type 2- Some Pokemon are dual type and have 2 (Secondary type), missing value means the Pokemon only has one type of element/attributeTotal- sum of all stats that come after this, a general guide to how strong a Pokemon is (overall stats)HP- hit points, or health, defines how much damage a Pokemon can withstand before faintingAttack- the base modifier for normal attacks (eg. Scratch, Punch)Defense- the base damage resistance against normal attacksSP Atk- special attack, the base modifier for special attacks (e.g. fire blast, bubble beam)SP Def- the base damage resistance against special attacksSpeed- determines which Pokemon attacks first each roundGeneration- the generation it came fromLegendary- True if Legendary Pokemon False if not
knitr::kable(head(Pokemon))| # | Name | Type 1 | Type 2 | Total | HP | Attack | Defense | Sp. Atk | Sp. Def | Speed | Generation | Legendary |
|---|---|---|---|---|---|---|---|---|---|---|---|---|
| 1 | Bulbasaur | Grass | Poison | 318 | 45 | 49 | 49 | 65 | 65 | 45 | 1 | FALSE |
| 2 | Ivysaur | Grass | Poison | 405 | 60 | 62 | 63 | 80 | 80 | 60 | 1 | FALSE |
| 3 | Venusaur | Grass | Poison | 525 | 80 | 82 | 83 | 100 | 100 | 80 | 1 | FALSE |
| 3 | VenusaurMega Venusaur | Grass | Poison | 625 | 80 | 100 | 123 | 122 | 120 | 80 | 1 | FALSE |
| 4 | Charmander | Fire | NA | 309 | 39 | 52 | 43 | 60 | 50 | 65 | 1 | FALSE |
| 5 | Charmeleon | Fire | NA | 405 | 58 | 64 | 58 | 80 | 65 | 80 | 1 | FALSE |
Data Manipulation
From the skim function, we see the variable Generation as a numeric variable which is wrong. The correct type for it is factor or categorical data, thus, we will have to manipulate the data to fix the issue.
Pokemon$Generation = as_factor(Pokemon$Generation)We also want to rename a few variables here for usage purposes here in R.
Pokemon = Pokemon %>%
  rename(no = '#',
         type1 = `Type 1`,
         type2 = `Type 2`,
         spatk = `Sp. Atk`,
         spdef = `Sp. Def`)
Questions & Visualization
1. Which primary Pokemon type (Type 1) and secondary Pokemon type (Type 2) is the most common?
Pokemon %>%
  ggplot() +
  geom_bar(aes(x = fct_infreq(type1)), fill = "red", colour = "black") +
  labs(x = "Primary Type", y = "Frequency", title = "Barplot for `Type 1` Pokemon") +
theme(axis.text.x = element_text(angle = 30)) 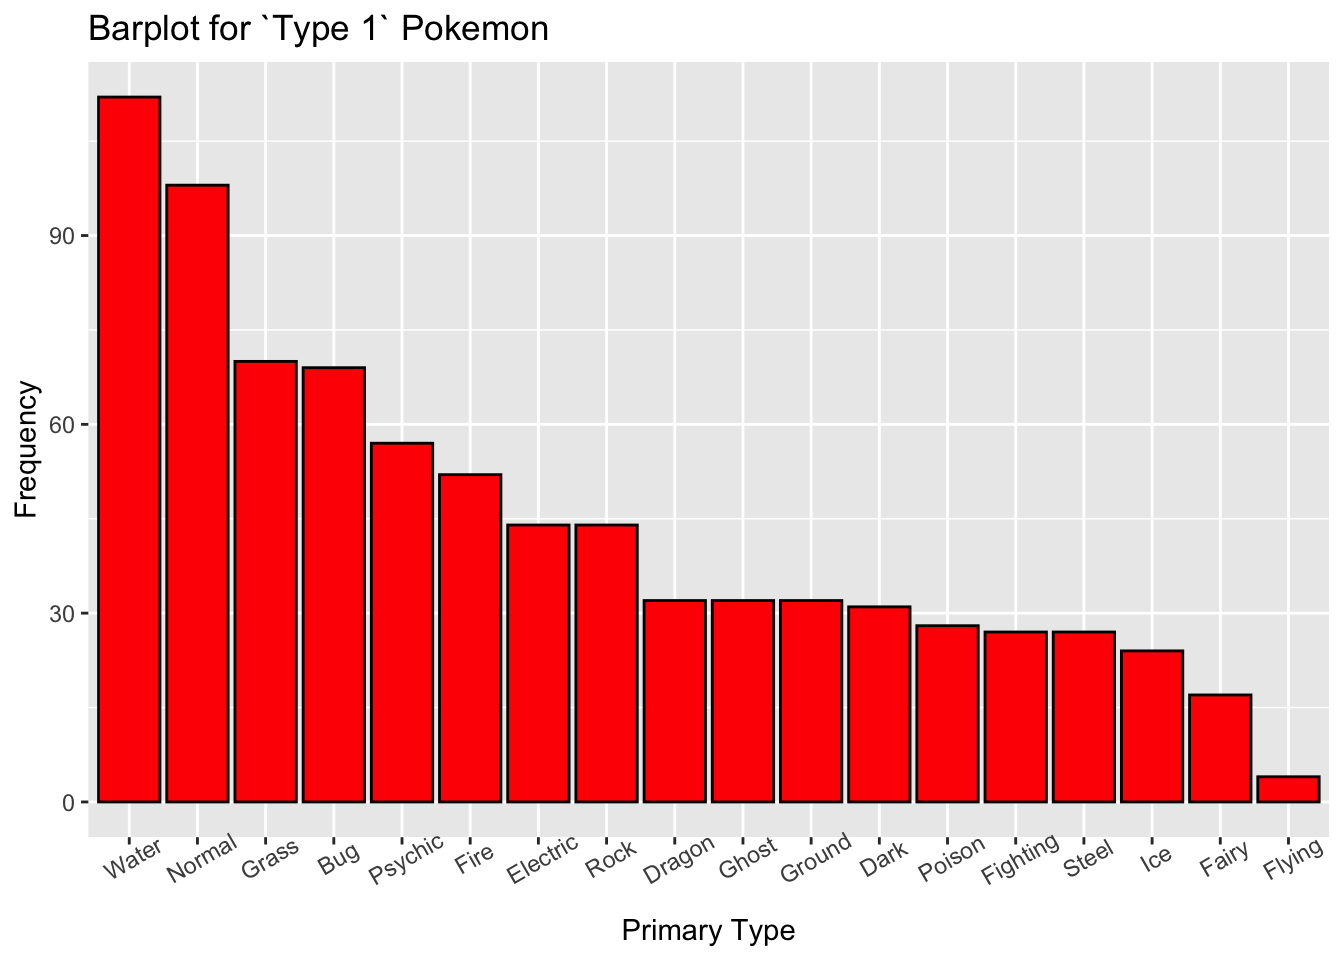
From the plot above, we can see that Water is the most common primary type in Pokemon.
- Follow-up question:
- Is something wrong with the data? Why Flying type is almost non-existent?
Pokemon %>%
  ggplot() +
  geom_bar(aes(x = fct_infreq(type2)), fill = "lightblue", colour = "black") +
  labs(x = "Secondary Type", y = "Frequency", title = "Barplot for `Type 2` Pokemon") +
theme(axis.text.x = element_text(angle = 30)) 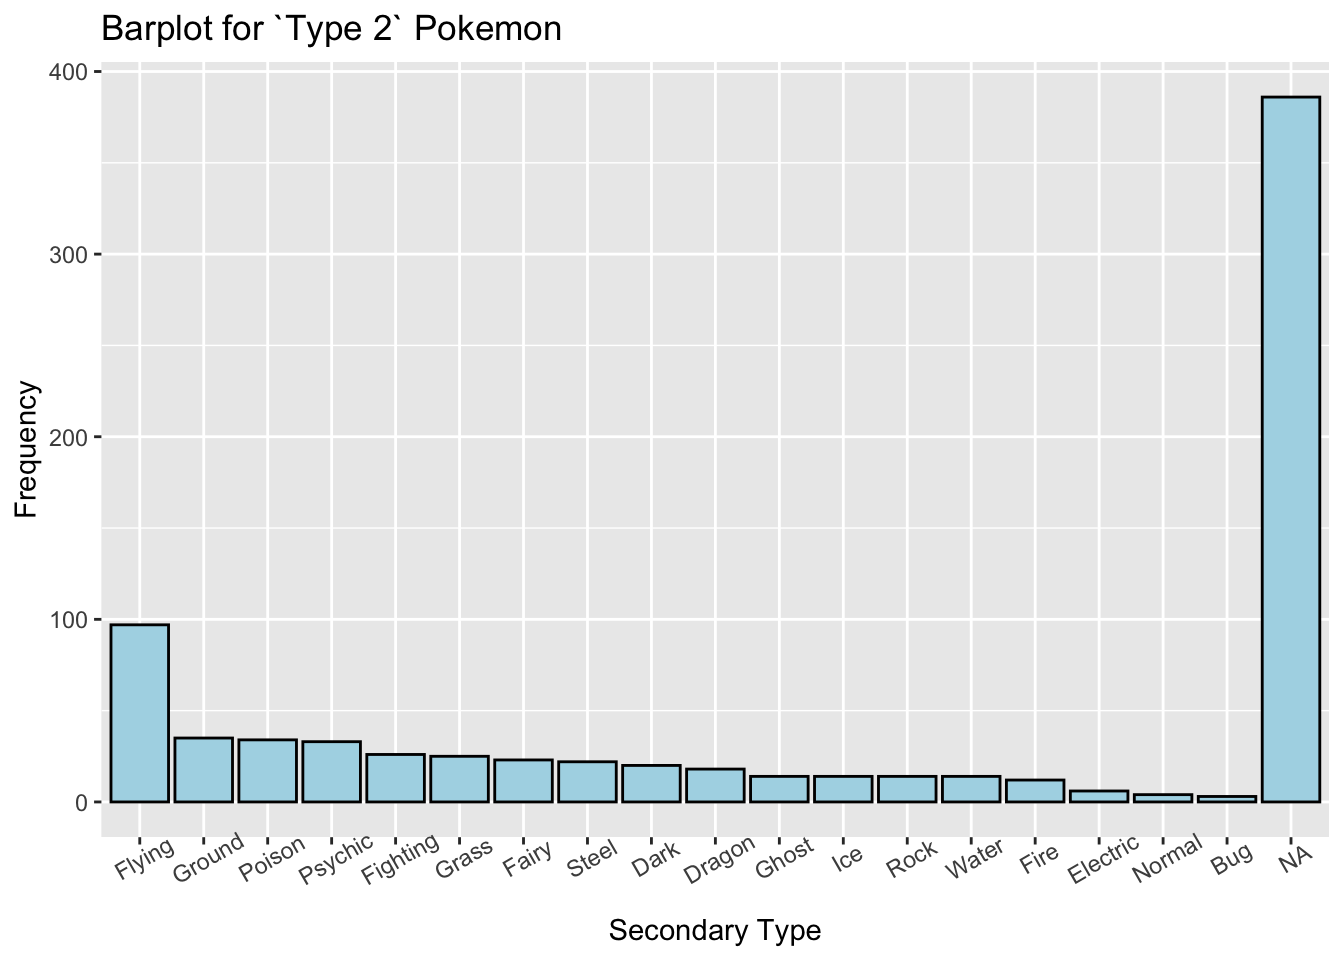
From the plot above, it is clear that most Pokemon do not have a secondary element or type. If we refer back to the data dictionary, missing values in the
Type 2variable means that the Pokemon only has one attribute or element.- Answer to follow-up question from part A:
- Flying-type is more commonly used for the secondary type. Thus, dual-type (having 2 types) Pokemon are more often to have Flying as their second type.
2. What is the most common type combination in Pokemon? (the most combined type / have dual-types)
# count frequency of each type combination
mixed = Pokemon %>%
  group_by(type1, type2) %>%
  summarise(count = n())

# create contingency table of `Type 1` & `Type 2`
mixed %>%
ggplot(aes(x = type1, y = type2)) +
  geom_tile(aes(fill = count), show.legend = FALSE) +
  geom_text(aes(label = count)) +
  labs(x = "Type 1", y = "Type 2",
       title = "Number of Pokemon for each type combination") +
  theme(axis.text.x = element_text(angle = 30)) +
scale_fill_gradient(low = "white", high = "blue") 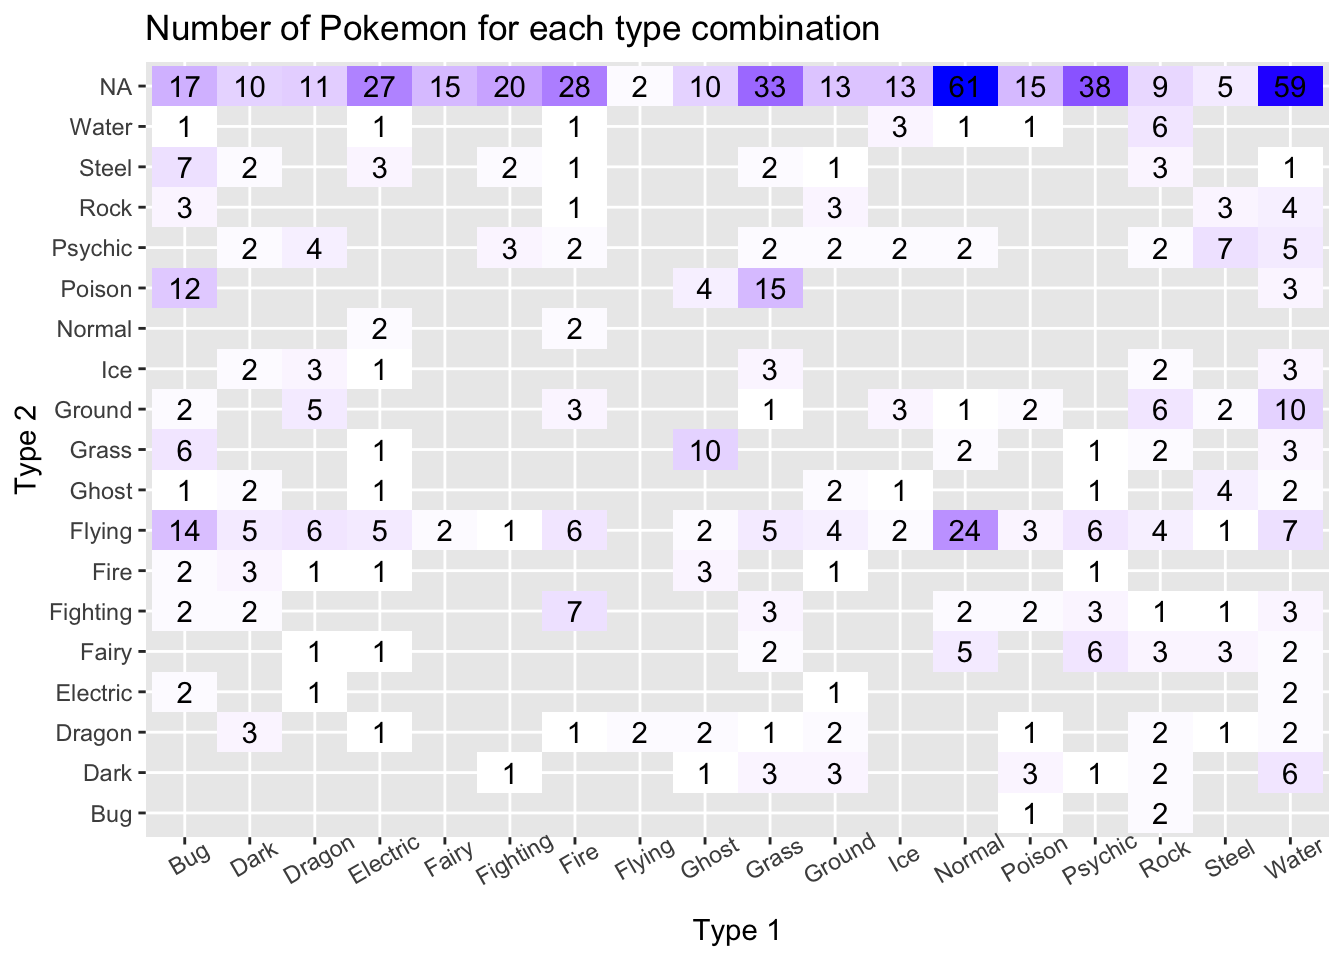
- From the contingency table above, we can see that the most common dual-type Pokemon is normal & flying with 24 Pokemon. We are ignoring the top row value which is the row for Pokemon that only has one element (primary type only).
3. Are Legendary Pokemon have better Stats (in terms of HP, Attack, Defense, Special Attack, Special Defense, Speed, and Total) than the normal ones?
# Density plot of HP
p01 = Pokemon %>%
  ggplot(aes(x = HP, fill = Legendary)) +
  geom_density() +
  labs(x = "HP", y = "Density") +
  theme_bw() +
  theme(legend.position = "none")

# Density plot of Attack
p02 = Pokemon %>%
  ggplot(aes(x = Attack, fill = Legendary)) +
  geom_density() +
  labs(x = "Attack", y = "Density") +
  theme_bw() +
  theme(legend.position = "none")

# Density plot of Defense
p03 = Pokemon %>%
  ggplot(aes(x = Defense, fill = Legendary)) +
  geom_density() +
  labs(x = "Defense", y = "Density") +
  theme_bw() +
  theme(legend.position = "none")

# Density plot of Special Attack
p04 = Pokemon %>%
  ggplot(aes(x = spatk, fill = Legendary)) +
  geom_density() +
  labs(x = "Special Attack", y = "Density") +
  theme_bw() +
  theme(legend.position = "none")

# Density plot of Special Defense
p05 = Pokemon %>%
  ggplot(aes(x = spdef, fill = Legendary)) +
  geom_density() +
  labs(x = "Special Defense", y = "Density") +
  theme_bw() +
  theme(legend.position = "none")

# Density plot of Speed
p06 = Pokemon %>%
  ggplot(aes(x = Speed, fill = Legendary)) +
  geom_density() +
  labs(x = "Speed", y = "Density") +
  theme_bw() +
  theme(legend.position = "none")

# Density plot of Total
p07 = Pokemon %>%
  ggplot(aes(x = Total, fill = Legendary)) +
  geom_density() +
  labs(x = "Total", y = "Density") +
  theme_bw()

# Print out all plots
grid.arrange(p01, p02, p03, p04, p05, p06, p07,layout_matrix = cbind(c(1,4,7), c(2,5,7), c(3,6,7)))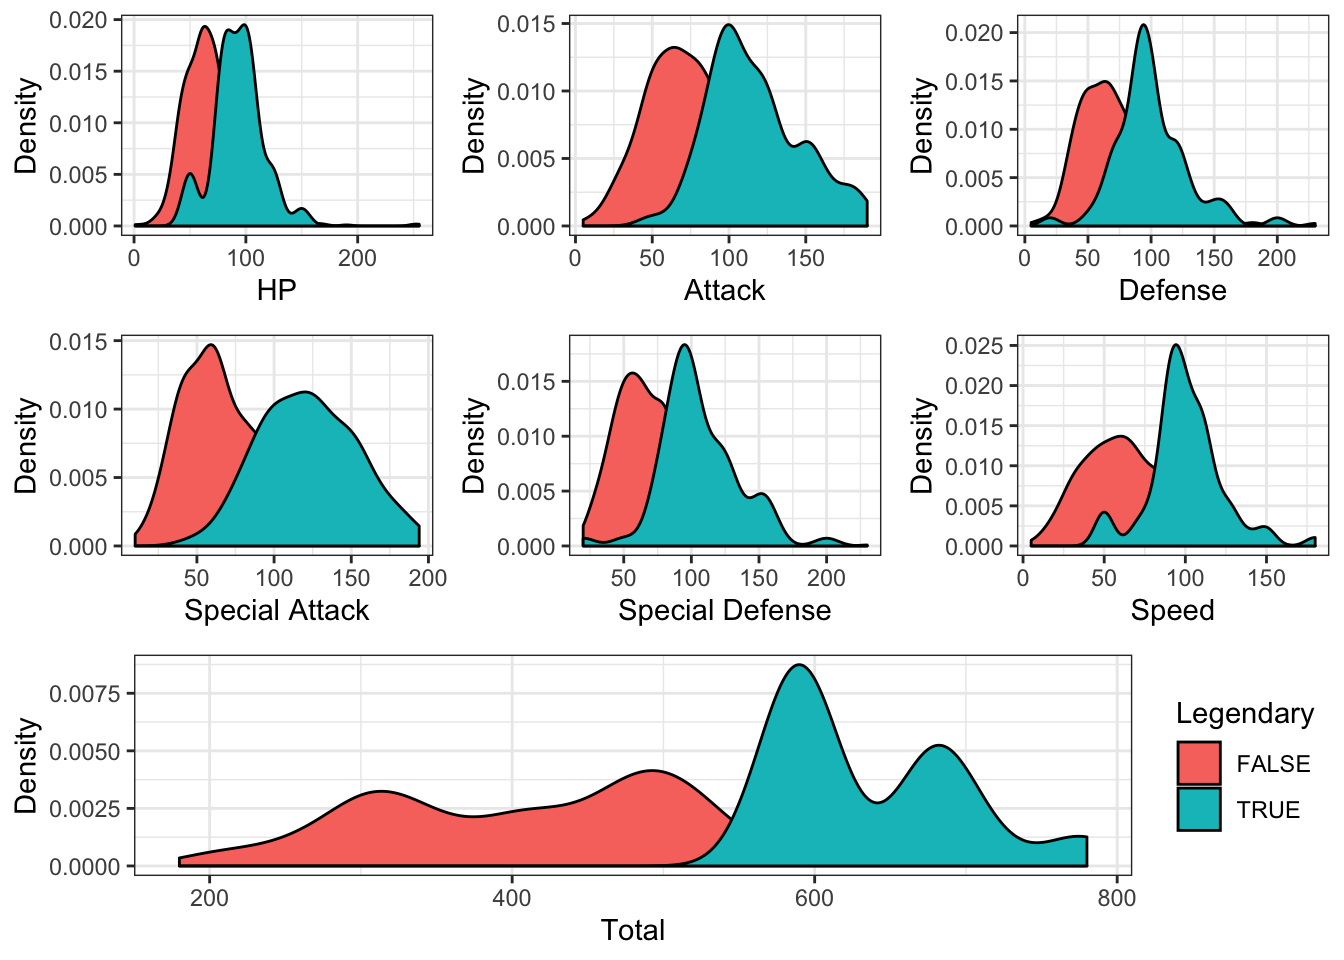
- From the plots that we produced above, it is clear that legendary Pokemon are better (have greater stats) than the normal ones. The legendary Pokemon are better in terms of all Stats (
HP,Attack,Defense,Special Attack,Special Defense,Speed, andTotal).
4. Which Pokemon generation have a better overall stats (Total)?
Pokemon %>%
  group_by(Generation) %>%
  summarize(Total = mean(Total)) %>%
  ggplot(aes(x = Generation, y = Total, group = 1)) +
  geom_line(colour = "yellow2") +
  geom_point() +
  labs(y="Average Total", title="Average Stats Total of Pokemon in each generation") +
theme_dark() 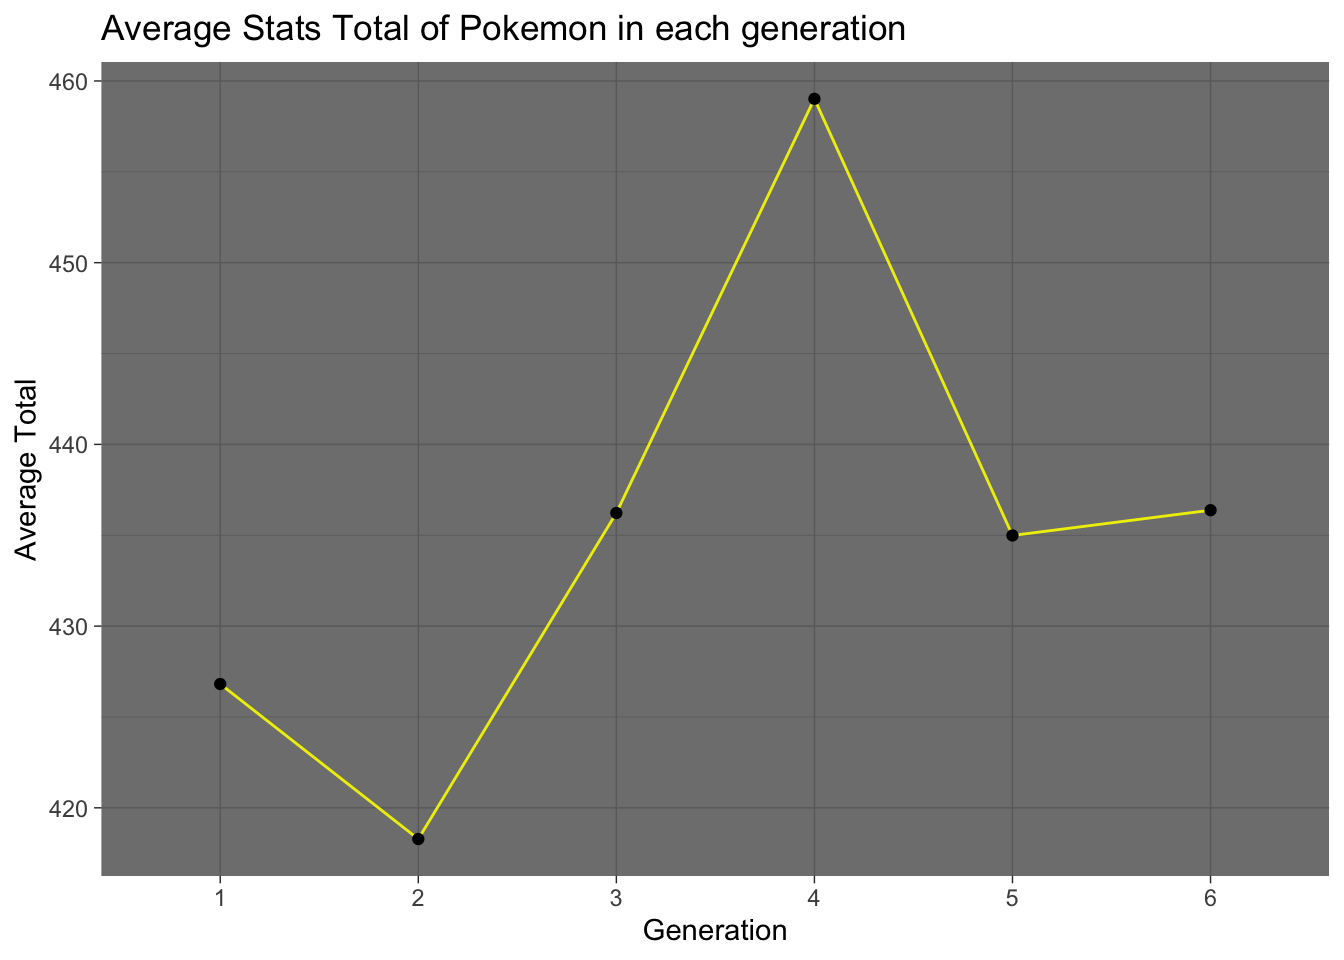
From the plot above, we see the fourth generation has the best overall total stats Pokemon. This means the Pokemon that came from the fourth generation has better stats than the others.
- Follow-up question:
- Is the result here is affected by the number of legendary Pokemon in the fourth generation?
- Answer in the next question.
- Is the result here is affected by the number of legendary Pokemon in the fourth generation?
5. Which generation has the most legendary Pokemon?
Pokemon %>%
  ggplot(aes(x = Generation, fill = Legendary)) +
  geom_bar(position="dodge") +
  geom_text(aes(label = ..count..), stat = "count", position = position_dodge(0.9), vjust = -0.4) +
  labs(x = "Generation", y = "Number of Pokemon",
       title = "Number of Legendary Pokemon per generation") +
theme_bw() 
The third generation have a greater number of legendary Pokemon than the rest generations.
- To answer the follow-up question from #4:
- This means the fourth generation’s Pokemon has the best overall stats in-game and not necessarily because of the number of legendary Pokemon it holds.
6. What is the strongest Pokemon in overall (Total) stats? Is it a legendary Pokemon?
Pokemon %>%
  select(Name, Total, Legendary) %>%
  arrange(desc(Total)) %>%
  slice(1:20) %>%
  ggplot(aes(x = reorder(Name, Total), y = Total)) +
  geom_bar(stat = "identity", aes(fill = Legendary), colour = "black") +
  geom_label(aes(label = Total)) +
  coord_flip() +
  labs(x = "Name", title = "Top 20 Pokemon in terms of Total Stats") +
theme_test() 
From the plot above, we can see that the most Pokemon that have the highest
Totalstats are legendary Pokemon.There are 3 Pokemon that share the highest
Totalstats in the game which are Mega Rayquaza, Mega Mewtwo Y, and Mega Mewtwo X. And all three of them are indeed a legendary Pokemon.This also supports the evidence that legendary Pokemon have higher stats than the normal ones.
7. What is the weakest Pokemon in overall (Total) stats? Is it a normal Pokemon?
Pokemon %>%
  select(Name, Total, Legendary) %>%
  arrange(Total) %>%
  slice(1:10) %>%
  ggplot(aes(x = reorder(Name, desc(Total)), y = Total)) +
  geom_bar(stat = "identity", aes(fill = Legendary), colour = "black") +
  geom_label(aes(label = Total)) +
  coord_flip() +
  labs(x = "Name", title = "10 weakest Pokemon in terms of Total Stats") +
theme_test() 
The weakest Pokemon in terms of
Totalstats is Sunkern. And all Pokemon that have low stats are normal Pokemon.This makes sense since legendary Pokemon is equivalent or stronger than the final evolution (not mega evolution) from a normal Pokemon.
8. Is there a relationship between Pokemon primary types (Type 1) and Total stats?
Pokemon %>%
  group_by(type1) %>%
  mutate(midquartile = median(Total)) %>%
  ggplot(aes(x = reorder(type1, Total, FUN = median), y = Total)) +
  geom_boxplot(aes(fill = midquartile)) +
  scale_fill_gradient(low = "yellow", high = "red3") +
  coord_flip() +
  labs(x = "Type 1", title = "Boxplot of Total") +
  theme_bw() +
  theme(legend.position = "none")
- The plot above tells us that Dragon-type Pokemon are the strongest out of the other Pokemon type. From the median value, it clearly tells us that the Dragon-type have a very impressive stats.